
Mapping the Sky: Dunhuang Star Chart
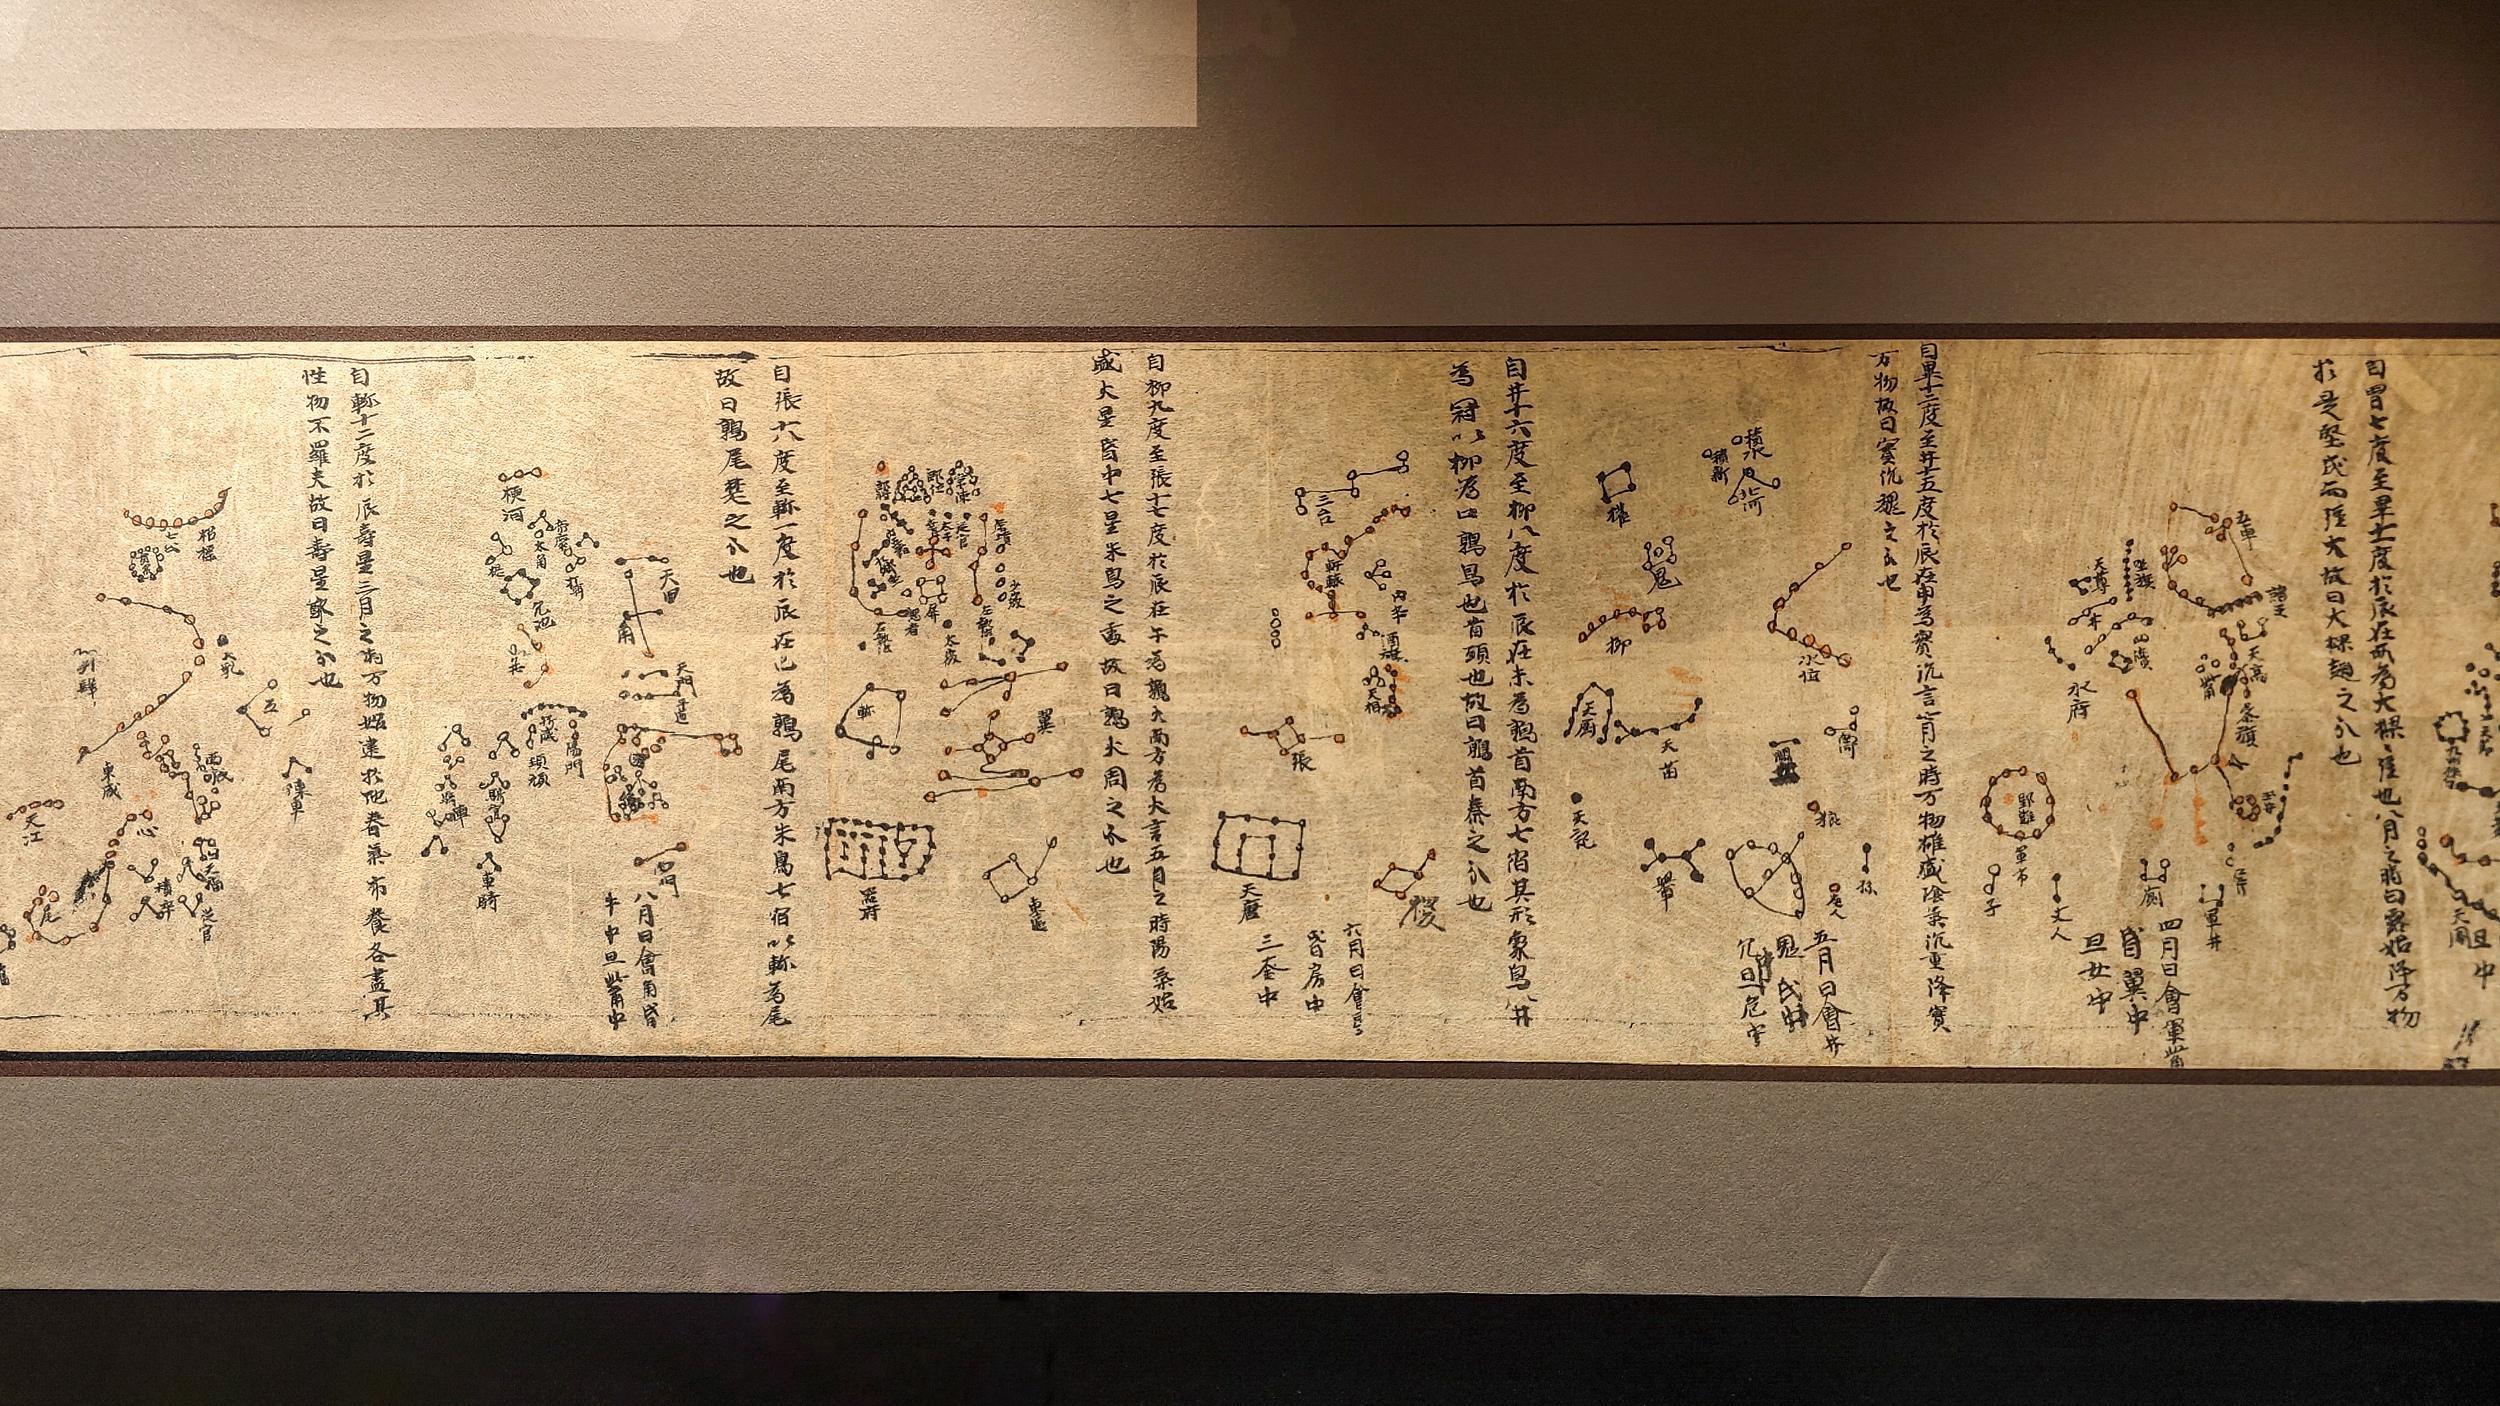
Dating back to the Tang dynasty (618-907), the Dunhuang Star Chart is one of the earliest known graphical depictions of the night sky in ancient Chinese astronomy. It visually corroborates star-related information recorded in early Chinese texts, and is part of a scroll that includes a series of illustrations found among the Dunhuang manuscripts.
The chart itself is the second part of a longer scroll measuring more than 300 cm by 24.4 cm, made of 13 panels of fine paper. Read from right to left, the first part of the scroll is a divination manual based on cloud shapes, a practice known as uranomancy. Just as ancient Chinese astrologers used the stars to predict future events, they also observed atmospheric phenomena.
The chart divides the sky into 12 sections representing the months of the Chinese year, beginning with December. These sections are spaced at 30° intervals, moving from east to west. Each section is accompanied by text describing the sky and providing astrological predictions for events in different parts of the Chinese Empire.
This detailed star atlas shows more than 1,300 stars. The positioning is remarkably accurate for a hand-drawn document and compares favorably with modern charts.
The 13th and final chart depicts the north circumpolar region. This is the area of the sky towards which the Earth is tilted on its axis. As the Earth remains tilted in the same direction throughout its orbit around the Sun, these stars remain visible in the night sky all year round. Other stars are only visible seasonally.
In ancient China, the celestial north pole was considered to be the center of the sky. According to Chinese astrology, this is the most important part of the cosmos, housing the "three enclosures."
As well as its historical significance, the atlas is important for modern astronomers because of its accuracy and graphic quality. Like the Earth, the sky is spherical and appears to us as a dome. The process of converting points from a spherical object onto a flat piece of paper is known as "projection" in map making and involves complicated mathematics.